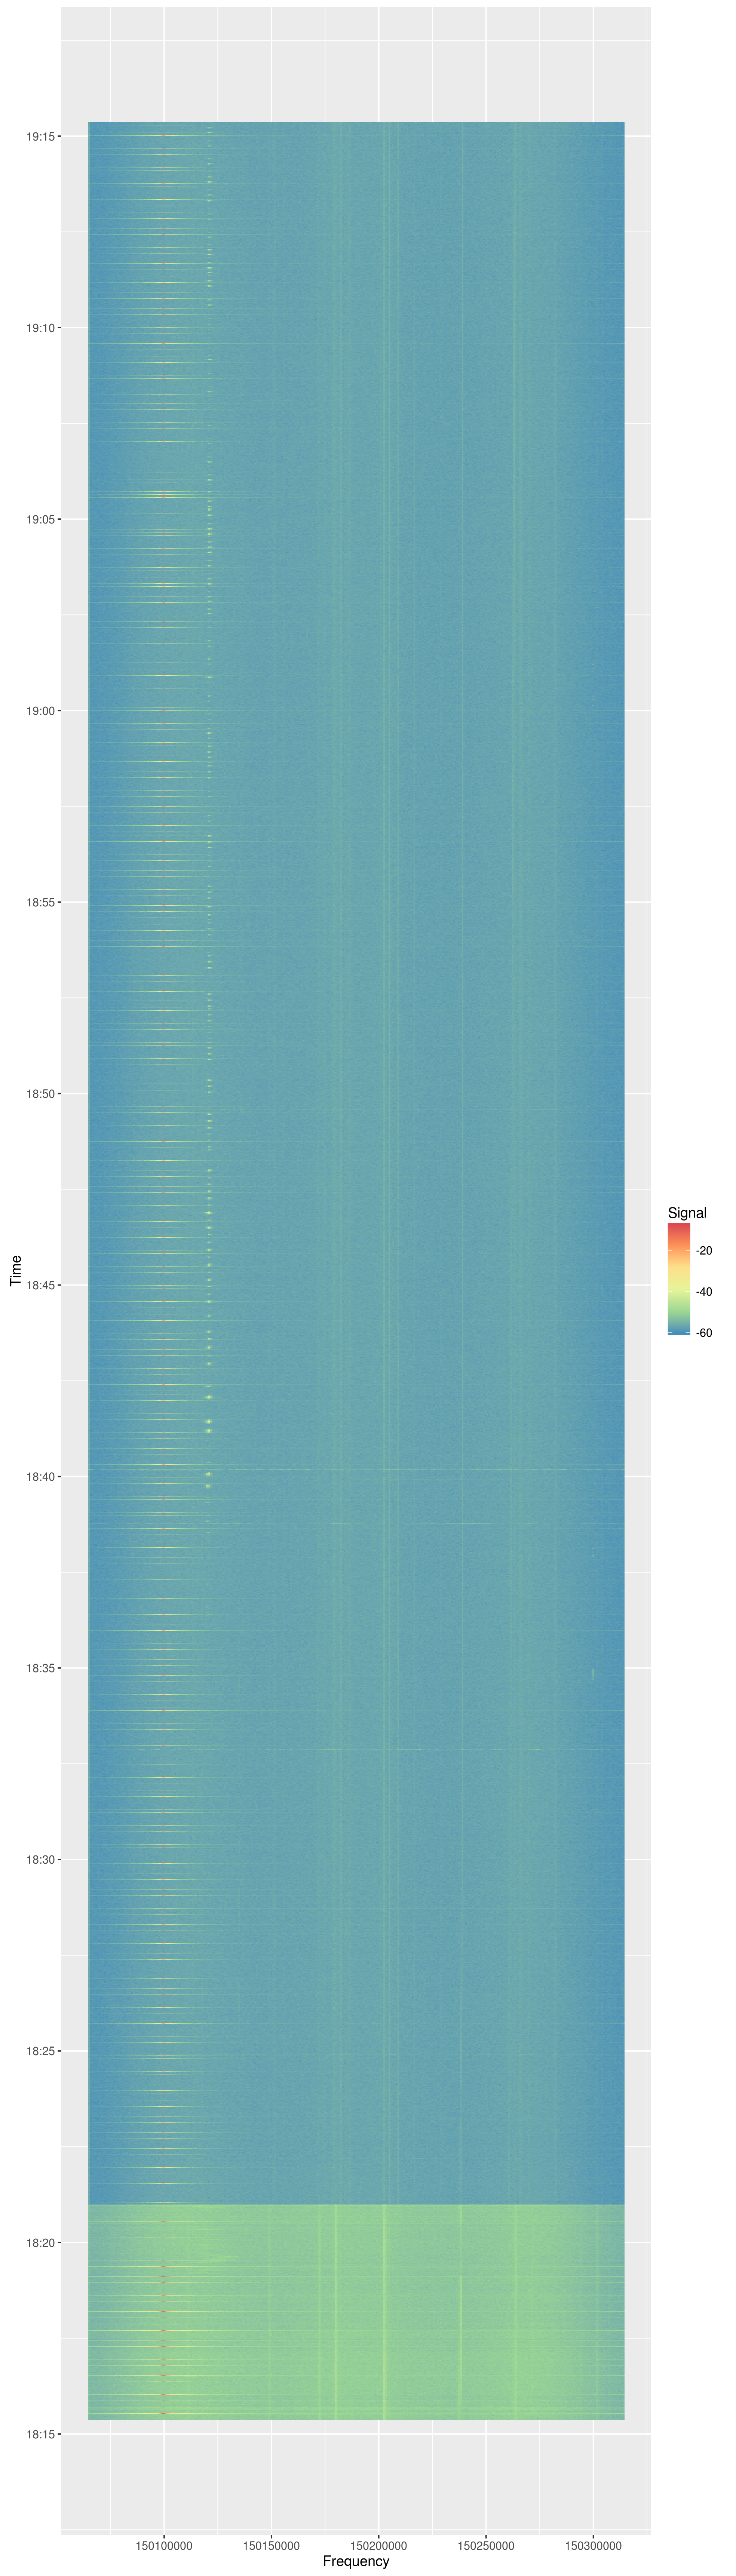
To identify transmitters a in frequency range (250kHz), a Frequency-Time Map is plotted. On the y-Axis is the time and on the x-Axis the Frequency. On the heat map you will find two signals and several interferences. This is the non-filtered output. The R-Scripts will be available to download soon.