With the new feature it is now possible to record a frequency spectrum. On the x-Axis the frequency is plotted and on the y-Axis the time. The picture below shows 150.2kHz – 151.7kHz and 1 minute recording time.

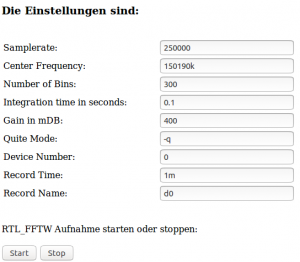
The website for recording such an image is quite technical, but can be simplified. The data is directly loaded into R and can be analysed.